March 2026 - Precious Metal Market News
Synopsis
Is this a case of deja vu? When we thought we had seen it all in January before the (relative) calm of February, March makes its mark with more historic volatility. Geopolitical upset driven by the war between US/Israel and Iran has impacted multiple markets, with precious metals not to be left out.

Gold Dragged Into a Fight
After the initial boost seen at the beginning of the month, following the US and Israel attack on Iran in the final weekend of February, Gold experienced a dip of just over 4% and then sat relatively stable between £3,800-£3,880 for the first couple of weeks.
However, during the 18th and 19th March, gold saw sharp dips driven by a "perfect storm" of a stronger US dollar, "hawkish" signals from central banks on-top of investors selling assets to cover losses elsewhere, as oil prices reversed course and the US stock markets fell.
For the following weeks leading into April, gold did begin to rebound and saw a climb back to £3,518.89 per troy ounce.
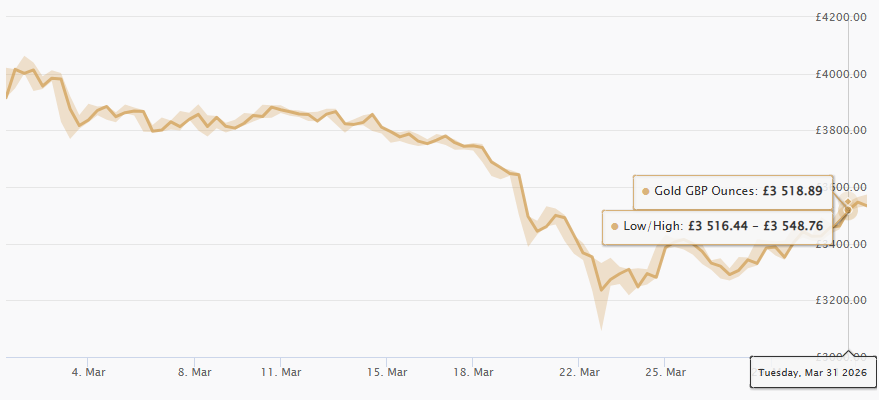
Gold's year so far:
Low: £3,090.95
High: £4,063.58
Change: +10.6% (approximately)

Much the Same for Silver
As we have seen since January's drop, silver has been following closely to gold's performance and March was no different. Seeing a high of £71.44 following the US/Israel attack on Iran, silver fell and settled between £61-£65 before seeing a slightly more prolonged dip to gold, eventually hitting a low of £47.93 per troy ounce on 23rd March.
Things did start to look up though, as silver ended the month on approximately £56.61 per troy ounce, an increase of ~6.4% from the start of the year.

Silver's year so far:
Low: £45.94
High: £87.94
Change: +6.42% (approximately)

Platinum Follows the Pack
Whilst following the same trends from a high-level view, platinum has had a rough go of things so far in 2026. Platinum saw a high of £1,794.33 following the conflict's start, before sharply dropping to £1,540.74. It then saw more fluctuation than it's gold and silver cousins throughout the month, sitting between £1,540-1,656 in the middle weeks before a slide mirroring silver's, eventually hitting a low of £1,383.40 on the 23rd March.
Like with silver, things did look up during the final week of the month, with the platinum finally hitting £1,483.64 on the 31st March.
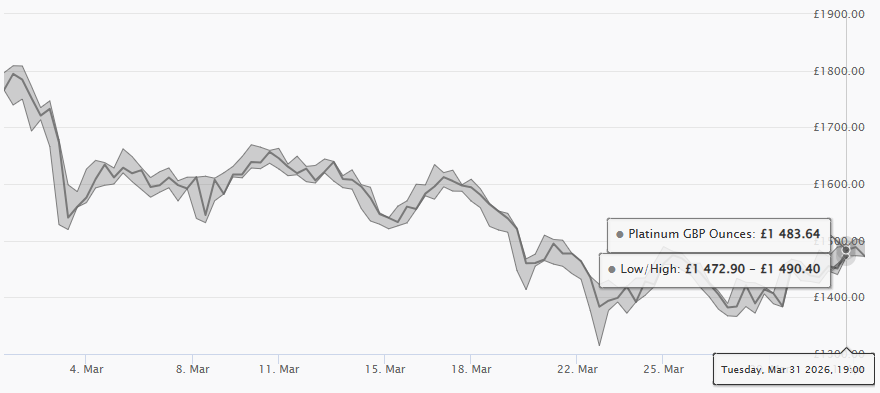
Platinum's year so far:
Low: £1,479.17
High: £2,138.29
Change: -1.76% (approximately)

Positivity Ahead in April?
Although there's a growing feeling to take any and all headlines and articles with a pinch of salt in recent months (and years), the latest news at the beginning of April is of the war ending with the US pulling out "within two or three weeks", prompting a positive shift in the precious metals market after recent negative downtrends.
Experts are now pointing to a potential return to the bullish attitudes seen at the turn of the year and a continuation of January's rally following the "pause" seen in February and March.
Between the conflict still being up in the air despite tempered interest for the war, and the headlines generated daily, spurring tensions between supposed allied countries, "precious metal's moment" looks to be far from over.
Interested in more blogs? Check out our full range of articles including the Beginners Guide to Gold and Sovereign Guide.
This guide and its content is copyright of Chard (1964) Ltd - © Chard (1964) Ltd 2026. All rights reserved. Any redistribution or reproduction of part or all of the contents in any form is prohibited.
We are not financial advisers and we would always recommend that you consult with one prior to making any investment decision.
You can read more about copyright or our advice disclaimer on these links.